Cost of nuclear power: Difference between revisions
Pat Palmer (talk | contribs) (commenting out unused reference) |
(→Cost of fuel: delete "current" prices of uranium and thorium) |
||
| Line 26: | Line 26: | ||
== Cost of fuel == | == Cost of fuel == | ||
Uranium is traded on the New York Mercantile Exchange | Uranium is traded on the New York Mercantile Exchange. See Fig.2 for the price history. Top producers are Kazakhstan, Canada and Australia.<br> | ||
Thorium | Thorium is about three times more abundant than uranium.<ref>[https://pubs.usgs.gov/periodicals/mcs2020/mcs2020-thorium.pdf Thorium Data Sheet - Mineral Commodity Summaries 2020, USGS.gov]</ref><br> | ||
A kilogram of uranium has 22.4 million kWh of stored heat energy.<ref>[https://en.wikipedia.org/wiki/Energy_density Wikipedia, Energy_density]</ref> A Light Water Reactor (LWR) uses only 0.5% of this. A Fast Neutron Reactor (FNR) can use it all. If that FNR could generate 10 million kWh of electricity from one kg of uranium, the cost of future uranium could go to $100,000 per kg and not add more than a penny per kWh.<br> | A kilogram of uranium has 22.4 million kWh of stored heat energy.<ref>[https://en.wikipedia.org/wiki/Energy_density Wikipedia, Energy_density]</ref> A Light Water Reactor (LWR) uses only 0.5% of this. A Fast Neutron Reactor (FNR) can use it all. If that FNR could generate 10 million kWh of electricity from one kg of uranium, the cost of future uranium could go to $100,000 per kg and not add more than a penny per kWh.<br> | ||
A CANDU reactor uses natural uranium (0.7% U-235). LWRs need 3 to 5% enrichment. Some newer generation reactors need up to 20% enrichment. Weapons grade uranium (and plutonium from old bomb cores) can be easily "down-blended" and provide decades of power for all these reactors.<br> | A CANDU reactor uses natural uranium (0.7% U-235). LWRs need 3 to 5% enrichment. Some newer generation reactors need up to 20% enrichment. Weapons grade uranium (and plutonium from old bomb cores) can be easily "down-blended" and provide decades of power for all these reactors.<br> | ||
Revision as of 01:57, 7 June 2024
The cost of nuclear power is one of the major concerns in proposals for replacement of fossil fuels. This article is an answer to the questions raised in Nuclear_power_reconsidered.
There is much confusion over the measures of cost in power systems. To make a fair comparison of alternatives, we will use the two most fundamental - capital cost per kilowatt (kW) of generating capacity and operating cost per kilowatt-hour (kWh) of energy produced.[1] Capital cost includes construction and all equipment, but not land or transmission lines or government subsidies, tariffs and taxes. Operating cost includes fuel, maintenance and administration, and a realistic estimate of depreciation, but not license fees, tariffs and taxes. For storage systems, capital cost is normally per kWh of capacity, not total kWh delivered over a lifetime, and includes all ancillary equipment, like chargers and inverters.
Levelized cost is another measure that attempts to combine capital and operational costs in one number. It depends on the lifetime of assets, an assumed interest rate, and salvage value of the assets at end of life. Think of it as operating cost plus a mortgage payment.[2]

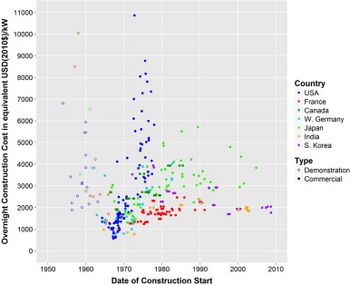
Fig.1 Construction costs for Pressurized Water Reactors (PWRs) have varied due to the political and regulatory environments in each country.[3]
Historical Costs
Existing nuclear plants have been very expensive (see Fig.1) due to the inherent risks in pressurized water reactors (PWR's) and the need for expensive structures and burdensome regulations to deal with that risk.[4] Newer designs promise to be much simpler, safer, and manufactured on an assembly line as replaceable parts, rather than site built.
Elimination of water at high pressure and temperature avoids the risk of steam explosions. Reactor vessels with non-destructive "meltdown" behavior avoid the risk of another Fukushima. A liquid fuel reactor can have plugs at the bottom of the reactor vessel that melt if the reactor gets too hot. The fuel then flows safely into drain tanks. A High Temperature Gas Reactor achieves the same level of safety with solid fuel balls continuously flowing out the bottom. Any loss of power will stop the recirculation of fuel balls to the top of the reactor.
Plants with replaceable parts can operate indefinitely.[5] Elimination of "decommissioning" costs will greatly improve the long-term economy of nuclear plants. If a plant is decommissioned, the process is little more than pulling out but not replacing all the parts. Cost is a lesser worry than the other issues, because the risk can be born by private companies promising to deliver reactors at an agreed price.[6]
Cost of new designs
Vendors step up. We need your numbers.
ThorCon MSR:
$1200 per kW + $0.03 per kWh estimated.[7]
GE Hitachi BWRX-300:
$2250 per kW promised.[8]
APR-1400:
$3286 pwr kW total construction cost for two 1400 MW Pressurized Water Reactors.[9]
NuScale SMR:
$20,130 per kW delivered.[10]

Cost of fuel
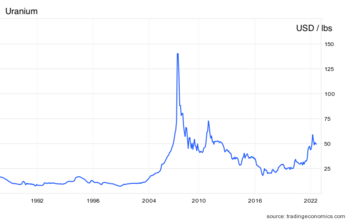
Uranium is traded on the New York Mercantile Exchange. See Fig.2 for the price history. Top producers are Kazakhstan, Canada and Australia.
Thorium is about three times more abundant than uranium.[12]
A kilogram of uranium has 22.4 million kWh of stored heat energy.[13] A Light Water Reactor (LWR) uses only 0.5% of this. A Fast Neutron Reactor (FNR) can use it all. If that FNR could generate 10 million kWh of electricity from one kg of uranium, the cost of future uranium could go to $100,000 per kg and not add more than a penny per kWh.
A CANDU reactor uses natural uranium (0.7% U-235). LWRs need 3 to 5% enrichment. Some newer generation reactors need up to 20% enrichment. Weapons grade uranium (and plutonium from old bomb cores) can be easily "down-blended" and provide decades of power for all these reactors.
Average cost of enrichment in 2021 was $99 per SWU (Separative Work Unit).[14] To make a kilogram of 5% enriched uranium requires 8.85 SWU. A kilogram at 20% requires 45 SWU.[15] About 90% of world enrichment capacity is in the five nuclear weapons states. These plus Germany, Netherlands and Japan provide enrichment services to the commercial market.[16] Any enrichment activities outside of these IAEA approved countries will be understood by many as a proliferation risk.[17]
Cost of alternatives
Capacity Factor (CF) is often ignored in discussions of intermittent sources like wind and solar. A typical rooftop solar panel system with a nameplate rating of 12 kW and a sunny climate in the Arizona desert will deliver 10 kW peak and 3 kW average over a year. A realistic cost per kW is therefore four times the often quoted cost. This does not include the cost of batteries, or any other storage that might be necessary for a regional utility. Storage is not necessary for rooftop systems, if the utility can provide full credit for power returned to the grid. The challenge for the utility is load following. If the fraction of total power on the grid from intermittent sources is too large (typically more than 30%), there may be extra expense for batteries or generators held as "spinning reserve" for rapid response when the intermittents drop out.
If the goal is 100% wind and solar, then we must add in the cost of storage. The most promising possibility is hydrogen at $0.12 per kWh (see below). Assuming this cost is distributed evenly over all demand, then the added cost per kWh depends on what fraction of the total power is delivered from storage. If that fraction is 1/3, then the added cost for all customers is $0.04 per kWh. This does not include capital cost of the storage system.
The biggest challenge in most storage systems is capital cost. A 10 GW regional grid with 3 GW average demand might need 100 hours of storage, or 300 GWh. This depends on the tolerance of the population for occasional outages when there is more than 100 hours of bad weather. There may be some additional cost for backup generators at hospitals, community shelters, and other critical services. Assuming that 100 hours of backup is the compromise, and we need to hold capital cost to no more than $10 billion, our storage facility can be no more than $30 per kWh (10% the current cost of batteries).
Rooftop Solar (no batteries)
Costs vary from one country to another, depending on taxes, tariffs, subsidies, and other factors.[18] These are USA prices in 2022 for a top quality system, professionally installed.[19] Prices in Australia may be lower by as much as a factor of three.[20]
$2,900 per kW (nameplate),[21]
$11,600 per kW avg (25% Capacity Factor)
$0.114 per kWh, assuming capital cost amortized at 6% interest over 20-year life.[22]
Utility-scale solar
50% of rooftop solar ???
Wind Turbines
$770–$850 per kW (nameplate), down from $1800 in 2008.[23]
$2030 per kW avg (35% Capacity Factor).[24]
Batteries:
USA Average in 2019: $589 per kWh, down 72% since 2015.[25]
Redox Flow Batteries: $25 per kWh promised.[26]
Iron Flow Batteries: < $20 per kWh "incremental cost" promised.[27]
Hydrogen:
Worldwide hydrogen production stood at 90 Mt in 2020, but since it was produced almost exclusively from fossil fuels, the result was close to 900 Mt of CO2 emissions.[28]
"Green" hydrogen (no CO2) can be produced from water using electrolysis, but the cost is much higher.[29]
There is also a possibility of separating hydrogen directly from water using a chemical process and abundant heat. See Energy_storage#Hydrogen for more on this.
Production costs
$2 per kg promised by mid 2020s[30][31]
$1 per kg ten-year goal set by DOE[32]
$0.12 per kWh electrical energy cost, assuming $2 per kg of H2, 50% overall efficiency, and zero for hydrogen storage cost.[33]
Storage costs
Salt Domes:
Steel Tanks:
Future Costs

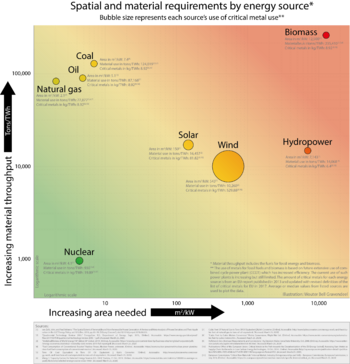
The worldwide transition from fossil fuels to carbon-free sources of energy may require enormous commitments of land and mineral resources. Getting to zero carbon, using currently favored wind and solar technologies, will require a breakthrough in energy storage. If this doesn't happen, or if material requirements exceed the available resources, the transition could fail, even after doubling the $5 trillion [35] already spent on renewable sources. To make reasonable guesses as to what the future may bring, we need for each proposed energy source, a clear understanding of the resource requirements and the expected future availability of those resources.
Figure 3 shows a compilation of data on the resources required by current technologies.[34] Land estimates ignore the possibility of dual use. Rooftop solar panels on existing buildings require essentially zero land. Wind turbines require large spacing, but the land between can be used for farming. The buffer zone around a nuclear plant can be used as a public park.[36]
Material estimates depend on the specific technology chosen. Pressurized Water Reactors (PWRs) require a containment building with thick walls of concrete and steel. Fast neutron reactors can be 100 times more efficient in uranium consumption than the present generation of PWRs. Material estimates per terawatt hour also depend on assumptions about lifetime of the source, and the possibility of recycling much of the original material.
For a good overview of the resource challenges in the energy transition, see:
- Global Energy Footprint, Hesthammer 2023. https://energy.glex.no/footprint
- Area and material consumption, Jonny Hesthammer PhD, former geology and geophysics professor at the University in Bergen, CEO M Vest Energy and Norsk Kjernekraft (Norwegian Nuclear Power) 28 Oct 2020. https://energy.glex.no/feature-stories/area-and-material-consumption
- The energy transition delusion: inescapable mineral realities, Energy expert Mark Mills speaks at SKAGEN Funds New Years Conference, 11 Jan 2023. https://www.youtube.com/watch?v=sgOEGKDVvsg
Further Reading
Projected Costs of Generating Electricity 2020 International Energy Agency's 223 page report, a thorough explanation of the complexities of LCOE (Levelized Cost of Electricity) and a proposal for a better all-in-one measure of cost VALCOE.
INSIDER: Not All Electricity Is Equal—Uses and Misuses of Levelized Cost of Electricity (LCOE) World Resources Institute (2019) Laura M. Valeri. Read this to understand why there is so much controversy over the cost of various sources in discussions on the Internet.
Notes and References
- ↑ Another point of confusion is wholesale vs retail cost. In this article "cost" will always be what the end user pays, be it a utility buying a power plant, or a homeowner buying solar panels.
- ↑ Although simple in principle, determining the Levelized Cost of Electricity (LCOE) for a particular source can get quite complex, involving many factors, such as an assumed cost of carbon emissions, and reductions in capacity factor due to other sources on the grid having priority when there is excess available power. For a thorough analysis of these factors (and an attempt to define a new all-in-one measure VALCOE) see the IEA report and the cautionary note from the World Resources Institute in the Further Reading Section.
- ↑ Fig.12 in Lovering 2016 "Historical construction costs of global nuclear power reactors" https://doi.org/10.1016/j.enpol.2016.01.011
- ↑ There is controversy within the nuclear community as to whether these regulations are necessary, even with older design reactors. See Devanney (2023) ALARA for the case against current standards. See also Devanney (2023) Prototype Testing for a proposed better system for testing of new designs.
- ↑ Can Nuclear Plants be Immortal, Mark Nelson
- ↑ ThorCon has presented a detailed analysis showing the cost of their proposed plants as less than a coal plant.
- ↑ ThorCon's estimate of costs.
- ↑ BWRX-300 Fact Sheet 2021
- ↑ South Korea Shin Hanul units 3 & 4 approved June 2023.
- ↑ Devanney's analysis
- ↑ TradingEconomics.com/commodity/uranium downloaded 27 Aug 2022.
- ↑ Thorium Data Sheet - Mineral Commodity Summaries 2020, USGS.gov
- ↑ Wikipedia, Energy_density
- ↑ EIA.gov/uranium/marketing
- ↑ For the equations needed to compute Separative Work Units, see Wikipedia. Separative_work_units, 2022. Retrieved on 2022-10-09.
- ↑ WNA Information Library, Uranium Enrichment.
- ↑ Deutch et.al. 2006 Survival 46(4):65-79 DOI:10.1080/00396330412331342466
- ↑ https://qz.com/1960513/why-rooftop-solar-costs-more-than-it-should analysis of the reasons for high costs by Tim McDonnell 1/25/21.
- ↑ Consumer Affairs has updated state-by-state average costs for complete rooftop solar panel systems.
- ↑ https://www.solarquotes.com.au/systems/10kw/ prices of rooftop solar in Australia.
- ↑ Typical quote from a solar panel installer in Arizona for a 12 kW system.
- ↑ This is the number a homeowner should compare to the savings on a monthly utility bill. (Monthly payment on a $11,600 loan for 20 years at 6%: $83.17 / 730 hours per month = $0.114 per kWh.
- ↑ DOE report 30 Aug 2021
- ↑ Typical value for offshore wind turbines is 35% Wind Capacity Factors
- ↑ Battery Storage in the United States: An Update on Market Trends, EIA 2021
- ↑ Researchers Claim Redox Flow Battery Breakthrough Will Cost $25 Per KWh Or Less, Warwick University, Jan 2021.
- ↑ ESS Inc website Aug 2022.
- ↑ See the section "Hydrogen supplies are becoming cleaner … too slowly" in the IEA Global Hydrogen Review 2021.
- ↑ Depending on regional gas prices, the levelized cost of hydrogen production from natural gas ranges from $0.50 to $1.70 per kg. See the section "Low-carbon hydrogen can become competitive within the next decade" in the IEA Global Hydrogen Review 2021.
- ↑ Australian company Hysata says their new Capilary-Fed Electrolyzer will deliver 95% efficiency - PV Magazine 8/2/2022.
- ↑ Bristol Springs Solar project in Western Australia could generate hydrogen for less than $2/kg - PV Magazine 8/2/2022
- ↑ Department of Energy's "Hydrogen Shot"
- ↑ Energy density of H2 is 33 kWh/kg. ($2/kg / 33 kWh/kg / 50%) = $0.12/kWh.
- ↑ 34.0 34.1 Area and material consumption, Jonny Hesthammer PhD, former geology and geophysics professor at the University in Bergen, CEO M Vest Energy and Norsk Kjernekraft (Norwegian Nuclear Power) 28 Oct 2020. https://energy.glex.no/feature-stories/area-and-material-consumption
- ↑ Estimate from Dr. Mark Mills, at 05:40 in https://www.youtube.com/watch?v=sgOEGKDVvsg
- ↑ Nimby or Yimby a proposal for a nuclear plant on the Columbia river.