Great Depression in the United States/Tutorials: Difference between revisions
Jump to navigation
Jump to search

imported>Nick Gardner |
imported>Caesar Schinas m (Bot: Update image code) |
||
| (9 intermediate revisions by one other user not shown) | |||
| Line 11: | Line 11: | ||
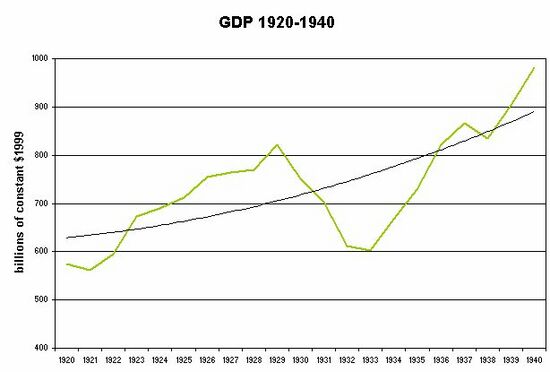
{{Image|Gdp20-40.jpg|center|550px|Chart 1: GDP annual pattern and long-term trend, 1920-40, in billions of constant dollars<ref> based on data in Susan Carter, ed. ''Historical Statistics of the US: Millennial Edition'' (2006) series Ca9 </ref>}} | |||
<references/> | <references/> | ||
| Line 18: | Line 18: | ||
==Employment Trend== | ==Employment Trend== | ||
{{Image|US-jobs2040.JPG|center|450px|Chart 2: total employment in US, excluding farms and WPA}} | |||
== | ==Components of expenditure== | ||
(billions of 1929 dollars) | |||
::::{| class="wikitable" | ::::{| class="wikitable" | ||
| Line 97: | Line 97: | ||
:::Source: Kendrik 1961 <ref name=Temin> Quoted in Peter Temin: ''Did Monetary Forces Cause the Great Depression?'', W W Norton 1976</ref> | :::Source: Kendrik 1961 <ref name=Temin> Quoted in Peter Temin: ''Did Monetary Forces Cause the Great Depression?'', W W Norton 1976</ref> | ||
==Industrial Production== | |||
(1935-9 = 100, seasonally corrected) | |||
:::::{| class="wikitable" | |||
! | |||
!style="background:#eeeeee;" |Jan | |||
!style="background:#eeeeee;" |Feb | |||
!style="background:#eeeeee;" |Mar | |||
!style="background:#eeeeee;" |April | |||
!style="background:#eeeeee;" |May | |||
!style="background:#eeeeee;" |June | |||
!style="background:#eeeeee;" |July | |||
!style="background:#eeeeee;" |Aug | |||
!style="background:#eeeeee;" |Sep | |||
!style="background:#eeeeee;" |Oct | |||
!style="background:#eeeeee;" |Nov | |||
!style="background:#eeeeee;" |Dec | |||
|- | |||
|align="center"|1929 | |||
|align="center"| | |||
|align="center"| | |||
|align="center"| | |||
|align="center"| | |||
|align="center"| | |||
|align="center"| | |||
|align="center"|114 | |||
|align="center"|114 | |||
|align="center"|112 | |||
|align="center"|110 | |||
|align="center"|105 | |||
|align="center"|100 | |||
|- | |||
|align="center"|1930 | |||
|align="center"|100 | |||
|align="center"|100 | |||
|align="center"|98 | |||
|align="center"|98 | |||
|align="center"|96 | |||
|align="center"|93 | |||
|align="center"|89 | |||
|align="center"|86 | |||
|align="center"|85 | |||
|align="center"|83 | |||
|align="center"|81 | |||
|align="center"|79 | |||
|- | |||
|align="center"|1931 | |||
|align="center"|78 | |||
|align="center"|79 | |||
|align="center"|80 | |||
|align="center"|80 | |||
|align="center"|80 | |||
|align="center"|77 | |||
|align="center"|76 | |||
|align="center"|73 | |||
|align="center"|68 | |||
|align="center"|67 | |||
|align="center"|66 | |||
|align="center"|64 | |||
|- | |||
|align="center"|1932 | |||
|align="center"|64 | |||
|align="center"|63 | |||
|align="center"|62 | |||
|align="center"|58 | |||
|align="center"|56 | |||
|align="center"|54 | |||
|align="center"|53 | |||
|align="center"|54 | |||
|align="center"|58 | |||
|align="center"|60 | |||
|align="center"|59 | |||
|align="center"|58 | |||
|- | |||
|align="center"|1933 | |||
|align="center"|58 | |||
|align="center"|57 | |||
|align="center"|54 | |||
|align="center"| | |||
|align="center"| | |||
|align="center"| | |||
|align="center"| | |||
|align="center"| | |||
|align="center"| | |||
|align="center"| | |||
|align="center"| | |||
|align="center"| | |||
|} | |||
:::::Source: Federal Reserve Bulletin (quoted in Bernanke<ref name=Bernanke> Ben Bernanke: ''Essays on the Great Depression'', Princeton University Press, 2000</ref>.) | |||
==Price Indexes== | ==Price Indexes== | ||
| Line 103: | Line 193: | ||
:::::{| class="wikitable" | :::::{| class="wikitable" | ||
! | ! | ||
!style="background:#eeeeee;" |1926 | |||
!style="background:#eeeeee;" |1927 | |||
!style="background:#eeeeee;" |1928 | !style="background:#eeeeee;" |1928 | ||
!style="background:#eeeeee;" |1929 | !style="background:#eeeeee;" |1929 | ||
| Line 115: | Line 207: | ||
|- | |- | ||
|align="center"|Wholesale Prices | |align="center"|Wholesale Prices | ||
|align="center"|65.0 | |||
|align="center"|62.0 | |||
|align="center"|62.9 | |align="center"|62.9 | ||
|align="center"|61.9 | |align="center"|61.9 | ||
| Line 127: | Line 221: | ||
|- | |- | ||
|align="center"|Consumer Prices | |align="center"|Consumer Prices | ||
|align="center"|75.6 | |||
|align="center"|74.2 | |||
|align="center"|73.3 | |align="center"|73.3 | ||
|align="center"|73.3 | |align="center"|73.3 | ||
| Line 146: | Line 242: | ||
:::::{| class="wikitable" | :::::{| class="wikitable" | ||
! | ! | ||
!style="background:#eeeeee;" |1926 | |||
!style="background:#eeeeee;" |1927 | |||
!style="background:#eeeeee;" |1928 | !style="background:#eeeeee;" |1928 | ||
!style="background:#eeeeee;" |1929 | !style="background:#eeeeee;" |1929 | ||
| Line 158: | Line 256: | ||
|- | |- | ||
|align="center"|M1 | |align="center"|M1 | ||
|align="center"|25.9 | |||
|align="center"|25.9 | |||
|align="center"|26.2 | |align="center"|26.2 | ||
|align="center"|26.4 | |align="center"|26.4 | ||
| Line 170: | Line 270: | ||
|- | |- | ||
|align="center"|M2 | |align="center"|M2 | ||
|align="center"|43.3 | |||
|align="center"|44.5 | |||
|align="center"|46.1 | |align="center"|46.1 | ||
|align="center"|46.2 | |align="center"|46.2 | ||
| Line 182: | Line 284: | ||
|- | |- | ||
|align="center"|High-powered money | |align="center"|High-powered money | ||
|align="center"|7.1 | |||
|align="center"|7.2 | |||
|align="center"|7.1 | |align="center"|7.1 | ||
|align="center"|7.1 | |align="center"|7.1 | ||
| Line 198: | Line 302: | ||
==Fiscal Stance== | ==Fiscal Stance== | ||
(Full employment deficit - see the [[/Related Articles|Glossary]]) | |||
{| class="wikitable" | {| class="wikitable" | ||
| Line 223: | Line 327: | ||
|align="center"|-1.5 | |align="center"|-1.5 | ||
|align="center"|-1.0 | |align="center"|-1.0 | ||
|align="center"|2.0 | |align="center"|-2.0 | ||
|align="center"|2.0 | |align="center"|-2.0 | ||
|align="center"|2.0 | |align="center"|-2.0 | ||
|align="center"|2.0 | |align="center"|-2.0 | ||
|align="center"|2.5 | |align="center"|-2.5 | ||
|align="center"|0 | |align="center"|0 | ||
|align="center"|1.0 | |align="center"|-1.0 | ||
|align="center"|1.0 | |align="center"|-1.0 | ||
|align="center"|0 | |align="center"|0 | ||
|align="center"|1.0 | |align="center"|1.0 | ||
| Line 238: | Line 342: | ||
|} | |} | ||
Sources: De Long [http://econ161.berkeley.edu/pdf_files/Defining_Moment_Draft.pdf] and Krugman [http://krugman.blogs.nytimes.com/2008/11/10/fiscal-fdr/] | :Sources: De Long [http://econ161.berkeley.edu/pdf_files/Defining_Moment_Draft.pdf] and Krugman [http://krugman.blogs.nytimes.com/2008/11/10/fiscal-fdr/] | ||
== | ==Unemployment== | ||
(% of civilian labour force. WPA employees are not included) | |||
:::::{| class="wikitable" | :::::{| class="wikitable" | ||
| Line 254: | Line 358: | ||
!style="background:#eeeeee;" |1937 | !style="background:#eeeeee;" |1937 | ||
!style="background:#eeeeee;" |1938 | !style="background:#eeeeee;" |1938 | ||
|- | |- | ||
|align="center"|Unemployment | |align="center"|Unemployment | ||
| Line 286: | Line 380: | ||
!style="background:#eeeeee;" |1933 | !style="background:#eeeeee;" |1933 | ||
|- | |- | ||
|align="center"|Percent of operating banks | |align="center"|Percent of operating banks | ||
|align="center"|5.6 | |align="center"|5.6 | ||
|align="center"|10.5 | |align="center"|10.5 | ||
| Line 292: | Line 386: | ||
|align="center"|12.9 | |align="center"|12.9 | ||
|} | |} | ||
::::::Source: Bernanke (2000) <ref name=Bernanke/> | |||
==Stock exchange performance== | ==Stock exchange performance== | ||
(End-year Standard and Poor Composite series 1941-43 = 100, and annual earnings) | |||
(Averages of monthly Cowles series 1926=100 , and annual earnings) | |||
===Price indexes=== | ===Price indexes=== | ||
| Line 353: | Line 448: | ||
|} | |} | ||
Source: Temin (1976) <ref name=Temin> Peter Temin: Did Monetary Forces Cause the Great Depression'', WW Norton & co, 1976</ref> | ::Source: Temin (1976) <ref name=Temin> Peter Temin: Did Monetary Forces Cause the Great Depression'', WW Norton & co, 1976</ref> | ||
==References== | ==References== | ||
<references/> | <references/> | ||
Latest revision as of 04:33, 8 June 2009
- Statistics of the Depression
GDP Trend

Chart 1: GDP annual pattern and long-term trend, 1920-40, in billions of constant dollars[1]
- ↑ based on data in Susan Carter, ed. Historical Statistics of the US: Millennial Edition (2006) series Ca9
Employment Trend

Components of expenditure
(billions of 1929 dollars)
1926 1927 1928 1929 1930 1931 1932 1933 1934 1935 1936 1937 Gross National Product 96.4 97.3 98.5 104.4 95.1 89.5 76.4 74.2 80.8 91.4 100.9 109.1 Consumer Spending 71.5 73.2 74.8 79.0 74.7 72.2 66.0 64.6 68.0 72.3 79.7 82.6 Gross Investment 17.1 15.6 14.5 16.2 10.5 6.8 0.8 0.3 1.8 8.8 9.3 14.6 Construction 10.7 10.4 9.8 8.7 6.4 4.5 2.4 1.9 2.0 2.8 3.9 4.6
- Source: Kendrik 1961 [1]
Industrial Production
(1935-9 = 100, seasonally corrected)
Jan Feb Mar April May June July Aug Sep Oct Nov Dec 1929 114 114 112 110 105 100 1930 100 100 98 98 96 93 89 86 85 83 81 79 1931 78 79 80 80 80 77 76 73 68 67 66 64 1932 64 63 62 58 56 54 53 54 58 60 59 58 1933 58 57 54
- Source: Federal Reserve Bulletin (quoted in Bernanke[2].)
Price Indexes
(1947-49 = 100)
1926 1927 1928 1929 1930 1931 1932 1933 1934 1935 1936 1937 Wholesale Prices 65.0 62.0 62.9 61.9 56.1 47.4 42.1 42.8 48.7 52.0 52.5 56.1 Consumer Prices 75.6 74.2 73.3 73.3 71.4 65.0 58.4 55.3 57.2 58.7 59.3 61.4
- Source Historical Statistics[1]
Money Supply
(billions of dollars)
1926 1927 1928 1929 1930 1931 1932 1933 1934 1935 1936 1937 M1 25.9 25.9 26.2 26.4 25.4 23.6 20.5 19.4 21.5 25.5 29.2 30.3 M2 43.3 44.5 46.1 46.2 45.2 41.7 34.6 30.8 33.3 38.4 42.8 45.0 High-powered money 7.1 7.2 7.1 7.1 6.9 7.3 7.8 8.2 9.1 10.7 12.2 13.4
- Source: Friedman and Schwartz [1]
Fiscal Stance
(Full employment deficit - see the Glossary)
| 1929 | 1930 | 1931 | 1932 | 1933 | 1934 | 1935 | 1936 | 1937 | 1938 | 1939 | 1940 | 1941 | 1942 | 1943 | 1944 | |
|---|---|---|---|---|---|---|---|---|---|---|---|---|---|---|---|---|
| Deficit % of potential GDP | -0.5 | -1.5 | -1.0 | -2.0 | -2.0 | -2.0 | -2.0 | -2.5 | 0 | -1.0 | -1.0 | 0 | 1.0 | 2.0 | 15 | 25 |
Unemployment
(% of civilian labour force. WPA employees are not included)
1929 1931 1933 1934 1935 1936 1937 1938 Unemployment 3.1 16.1 20.6 16.0 14.2 9.9 9.1 12.5
- Source: Historical Statistics
Bank Failures
1930 1931 1932 1933 Percent of operating banks 5.6 10.5 7.8 12.9
- Source: Bernanke (2000) [2]
Stock exchange performance
(End-year Standard and Poor Composite series 1941-43 = 100, and annual earnings) (Averages of monthly Cowles series 1926=100 , and annual earnings)
Price indexes
1927 1928 1929 1930 1931 1932 Standard & Poor 17.7 24.4 21.5 15.3 8.1 6.9 Cowles 118 150 190 150 95 49
Price/earnings ratios
1927 1928 1929 1930 1931 1932 Standard & Poor 15.9 17.6 13.3 15.8 13.3 16.8 Cowles 13.2 13.7 16.1 21.1 33.7 138.9
- Source: Temin (1976) [1]