Great Depression in the United States/Tutorials: Difference between revisions
Jump to navigation
Jump to search

imported>Nick Gardner |
imported>Nick Gardner |
||
| Line 103: | Line 103: | ||
:::::{| class="wikitable" | :::::{| class="wikitable" | ||
! | ! | ||
!style="background:#eeeeee;" |1926 | |||
!style="background:#eeeeee;" |1927 | |||
!style="background:#eeeeee;" |1928 | !style="background:#eeeeee;" |1928 | ||
!style="background:#eeeeee;" |1929 | !style="background:#eeeeee;" |1929 | ||
| Line 115: | Line 117: | ||
|- | |- | ||
|align="center"|Wholesale Prices | |align="center"|Wholesale Prices | ||
|align="center"|65.0 | |||
|align="center"|62.0 | |||
|align="center"|62.9 | |align="center"|62.9 | ||
|align="center"|61.9 | |align="center"|61.9 | ||
|align="center"|47.4 | |align="center"|47.4 | ||
|align="center"|42.1 | |align="center"|42.1 | ||
| Line 127: | Line 130: | ||
|- | |- | ||
|align="center"|Consumer Prices | |align="center"|Consumer Prices | ||
|align="center"|75.6 | |||
|align="center"|74.2 | |||
|align="center"|73.3 | |align="center"|73.3 | ||
|align="center"|73.3 | |align="center"|73.3 | ||
Revision as of 11:24, 12 February 2009
- Statistics of the Depression
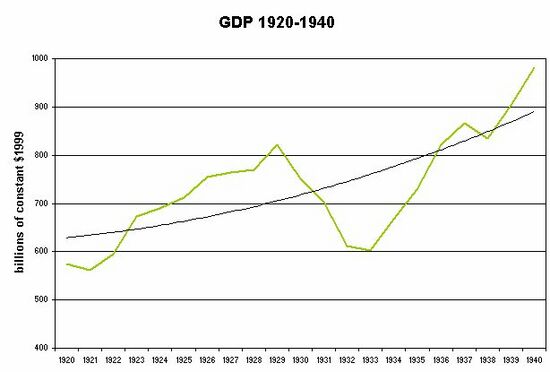
GDP Trend

Chart 1: GDP annual pattern and long-term trend, 1920-40, in billions of constant dollars[1]
- ↑ based on data in Susan Carter, ed. Historical Statistics of the US: Millennial Edition (2006) series Ca9
Employment Trend

Expenditure levels
- (billions of 1929 dollars)
1926 1927 1928 1929 1930 1931 1932 1933 1934 1935 1936 1937 Gross National Product 96.4 97.3 98.5 104.4 95.1 89.5 76.4 74.2 80.8 91.4 100.9 109.1 Consumer Spending 71.5 73.2 74.8 79.0 74.7 72.2 66.0 64.6 68.0 72.3 79.7 82.6 Gross Investment 17.1 15.6 14.5 16.2 10.5 6.8 0.8 0.3 1.8 8.8 9.3 14.6 Construction 10.7 10.4 9.8 8.7 6.4 4.5 2.4 1.9 2.0 2.8 3.9 4.6
- Source: Kendrik 1961 [1]
Price Indexes
(1947-49 = 100)
1926 1927 1928 1929 1930 1931 1932 1933 1934 1935 1936 1937 Wholesale Prices 65.0 62.0 62.9 61.9 47.4 42.1 42.8 48.7 52.0 52.5 56.1 Consumer Prices 75.6 74.2 73.3 73.3 71.4 65.0 58.4 55.3 57.2 58.7 59.3 61.4
- Source Historical Statistics[1]
Money Supply
(billions of dollars)
1928 1929 1930 1931 1932 1933 1934 1935 1936 1937 M1 26.2 26.4 25.4 23.6 20.5 19.4 21.5 25.5 29.2 30.3 M2 46.1 46.2 45.2 41.7 34.6 30.8 33.3 38.4 42.8 45.0 High-powered money 7.1 7.1 6.9 7.3 7.8 8.2 9.1 10.7 12.2 13.4
- Source: Friedman and Schwartz [1]
Fiscal Stance
- (Full employment deficit - see the Glossary)
| 1929 | 1930 | 1931 | 1932 | 1933 | 1934 | 1935 | 1936 | 1937 | 1938 | 1939 | 1940 | 1941 | 1942 | 1943 | 1944 | |
|---|---|---|---|---|---|---|---|---|---|---|---|---|---|---|---|---|
| Deficit % of potential GDP | -0.5 | -1.5 | -1.0 | 2.0 | 2.0 | 2.0 | 2.0 | 2.5 | 0 | 1.0 | 1.0 | 0 | 1.0 | 2.0 | 15 | 25 |
Sources: De Long [1] and Krugman [2]
Output and Unemployment
- (Output: 1935-39 = 100)
- (Unemployment: - excluding WPA employees - % of civilian labour force)
1929 1931 1933 1934 1935 1936 1937 1938 Industrial Production 109 75 69 112 Unemployment 3.1 16.1 20.6 16.0 14.2 9.9 9.1 12.5
- Source: Historical Statistics
Bank Failures
1930 1931 1932 1933 Percent of operating banks[2] 5.6 10.5 7.8 12.9
Stock exchange performance
- (End-year Standard and Poor Composite series 1941-43 = 100, and annual earnings)
- (Averages of monthly Cowles series 1926=100 , and annual earnings)
Price indexes
1927 1928 1929 1930 1931 1932 Standard & Poor 17.7 24.4 21.5 15.3 8.1 6.9 Cowles 118 150 190 150 95 49
Price/earnings ratios
1927 1928 1929 1930 1931 1932 Standard & Poor 15.9 17.6 13.3 15.8 13.3 16.8 Cowles 13.2 13.7 16.1 21.1 33.7 138.9
Source: Temin (1976) [1]