Wikipedia/Activity: Difference between revisions
Jump to navigation
Jump to search
imported>John R. Brews (→Decreased activity: shorten) |
imported>James Yolkowski (→Decreased activity: as a Wikipedia admin, I can tell you this is not true.) |
||
| Line 16: | Line 16: | ||
|In discussing the figure at left, the report suggests there may be a connection between the rapid drop in the percentage of Wikipedians making at least ''one'' edit a year after joining (red line), and the rapid upsurge in active editors that occurred in the same 2006-2007 time frame (blue line). One might conjecture this transition indicates a change in climate at WP. The graph shows that many new Wikipedians lost interest in continuing with WP, the fraction maintaining interest dropping from over 40% to only 10%. At the same time the number of editors actively contributing stopped rising and entered a slow decline to a level in 2012 of about two-thirds what it was at its peak in 2007. Discouragement of new contributors, whatever its cause, made it impossible to maintain the growth rate of WP. | |In discussing the figure at left, the report suggests there may be a connection between the rapid drop in the percentage of Wikipedians making at least ''one'' edit a year after joining (red line), and the rapid upsurge in active editors that occurred in the same 2006-2007 time frame (blue line). One might conjecture this transition indicates a change in climate at WP. The graph shows that many new Wikipedians lost interest in continuing with WP, the fraction maintaining interest dropping from over 40% to only 10%. At the same time the number of editors actively contributing stopped rising and entered a slow decline to a level in 2012 of about two-thirds what it was at its peak in 2007. Discouragement of new contributors, whatever its cause, made it impossible to maintain the growth rate of WP. | ||
|- | |- | ||
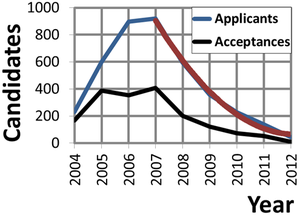
|The bottom figure on the right shows an upsurge in the number of Admin applicants during the 2006-2007 transitional phase. The vast majority of today's Admins were added in 2005-2007: 1,148 of them | |The bottom figure on the right shows an upsurge in the number of Admin applicants during the 2006-2007 transitional phase. The vast majority of today's Admins were added in 2005-2007: 1,148 of them. | ||
|- | |- | ||
|The transition of 2006-2007 is accompanied by a persistent drop in the number of formal cases for arbitration, the cases where evidence is formally assessed, which have fallen to about 12 per year. Reliance is now almost entirely upon adjudication by simpler means such as [http://en.wikipedia.org/wiki/Wikipedia:Administrators%27_noticeboard/Incidents ANI proceedings] or blocks by individual Administrators on their own recognizance. The lower figure on the left shows an average of 350 blocks ''per day'', which hugely dwarfs the solitary formal case of 1 ''per month'' in the figure above. | |The transition of 2006-2007 is accompanied by a persistent drop in the number of formal cases for arbitration, the cases where evidence is formally assessed, which have fallen to about 12 per year. Reliance is now almost entirely upon adjudication by simpler means such as [http://en.wikipedia.org/wiki/Wikipedia:Administrators%27_noticeboard/Incidents ANI proceedings] or blocks by individual Administrators on their own recognizance. The lower figure on the left shows an average of 350 blocks ''per day'', which hugely dwarfs the solitary formal case of 1 ''per month'' in the figure above. | ||
Revision as of 19:11, 11 July 2013
Introduction
From various statistics regarding Wikipedia activity, it appears that some sea change occurred approximately in the 2006-2007 time frame that resulted in a marked change in the activity on Wikipedia. This article presents some of this data. The answer as to what happened is unknown at this time. Coincidentally, some management changes occurred in this time frame, and in 2007 Jimmy Wales made Sue Gardner executive director of the Wikimedia Foundation.
Decreased activity


(PD) Image: John R. Brews
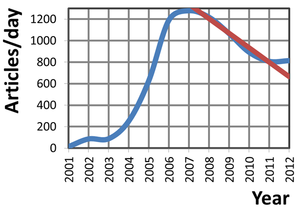
New articles per day on English WP. Average drop is 135 per year (Data from Wikimedia.)
New articles per day on English WP. Average drop is 135 per year (Data from Wikimedia.)

(PD) Image: John R. Brews
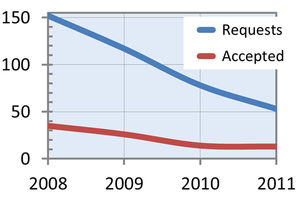
Requests by contributors for formal arbitration by year. (Data from English Wikipedia.)
Requests by contributors for formal arbitration by year. (Data from English Wikipedia.)

(PD) Image: John R. Brews
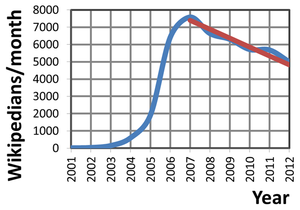
Number of newly registered contributors per month on English WP over its lifetime. Average drop in monthly enrollment is 515 per year (Data from Wikimedia.)
Number of newly registered contributors per month on English WP over its lifetime. Average drop in monthly enrollment is 515 per year (Data from Wikimedia.)

(PD) Image: John R. Brews
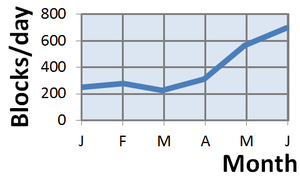
Average number of blocks per day each month in 2012. Data from English Wikipedia.
Average number of blocks per day each month in 2012. Data from English Wikipedia.

(PD) Image: John R. Brews
Number of Wikipedians applying for Administrator privileges on English Wikipedia. (Data from English Wikipedia.)
Number of Wikipedians applying for Administrator privileges on English Wikipedia. (Data from English Wikipedia.)
| As the figures to the right indicate, the period of rapid growth for WP is over, with the number of new articles and of new accounts exhibiting a sudden U-turn in rate of growth. The number of applicants for Adminship shows an even more dramatic loss of interest. It is unclear just what happened in 2006-2007 to cause the slowdown in activity. |
| A Wikimedia statistical report has posed this question. See the figure at left and discussion of this figure in Editor trends study/ Results. Wikimedia (May 11, 2011). The term 'editor' on Wikipedia means a person who has changed an article's content, and such change is the prerogative of any reader. |
| In discussing the figure at left, the report suggests there may be a connection between the rapid drop in the percentage of Wikipedians making at least one edit a year after joining (red line), and the rapid upsurge in active editors that occurred in the same 2006-2007 time frame (blue line). One might conjecture this transition indicates a change in climate at WP. The graph shows that many new Wikipedians lost interest in continuing with WP, the fraction maintaining interest dropping from over 40% to only 10%. At the same time the number of editors actively contributing stopped rising and entered a slow decline to a level in 2012 of about two-thirds what it was at its peak in 2007. Discouragement of new contributors, whatever its cause, made it impossible to maintain the growth rate of WP. |
| The bottom figure on the right shows an upsurge in the number of Admin applicants during the 2006-2007 transitional phase. The vast majority of today's Admins were added in 2005-2007: 1,148 of them. |
| The transition of 2006-2007 is accompanied by a persistent drop in the number of formal cases for arbitration, the cases where evidence is formally assessed, which have fallen to about 12 per year. Reliance is now almost entirely upon adjudication by simpler means such as ANI proceedings or blocks by individual Administrators on their own recognizance. The lower figure on the left shows an average of 350 blocks per day, which hugely dwarfs the solitary formal case of 1 per month in the figure above. |
| Further reading |
| Editor Trends Study/Results. Editor trends study. Wikimedia Strategic Planning (14 May, 2011). |
| See Sue Gardner: Executive director, Wikimedia Foundation. Wikimedia Foundation. Sue Gardner has announced plans for leaving and has appointed a transition team. |